Reliability
Power quality for maintenance teams: what an energy monitor reveals
Unbalance, harmonics, power factor and solar export explained for maintenance, with screens from the energy monitor taskfield is building.
A motor that runs hot for no obvious reason, a breaker that trips every now and then, a neutral hotter than the phases, a capacitor that bulges. Often the cause isn't the equipment but the power reaching it. A multimeter shows one instant; an energy monitor shows what happens all day long, phase by phase. In this article we explain what's worth watching and show the energy monitoring module we're building in taskfield.
Why maintenance should keep an eye on power
Power quality usually belongs to electrical engineering or the utility. But the effects show up on the shop floor:
- Voltage unbalance heats three-phase motors and shortens insulation life.
- Harmonics heat transformers, overload the neutral, cause nuisance trips and ruin capacitor banks.
- Low power factor increases current in the cables and can turn into a penalty on the bill.
- Voltage sags and swells shut down drives and burn out electronic power supplies.
Without continuous measurement, these causes end up as "electrical fault" on the work order, and the same failure comes back. With measurement, they become data: time, phase and magnitude.
Unbalance: voltage and current tell different stories
Voltage unbalance is the difference between the voltages of the three phases. It usually comes from the grid or from poorly distributed single-phase loads. Many grid codes and standards use a limit of around 2% to 3% for voltage unbalance. That sounds small, but the effect on the motor is amplified: 1% voltage unbalance can produce a current unbalance several times larger in the winding, and that turns into heat.
Current unbalance shows how the load is shared. In the screen below, voltage is balanced (0.86%), but current is at 78.6%: phase A carries 0.88 A while phases B and C are above 5 A. The reason, in this case, is that phases B and C are exporting power to the grid (the negative active power value) from solar generation, while phase A only feeds small loads.
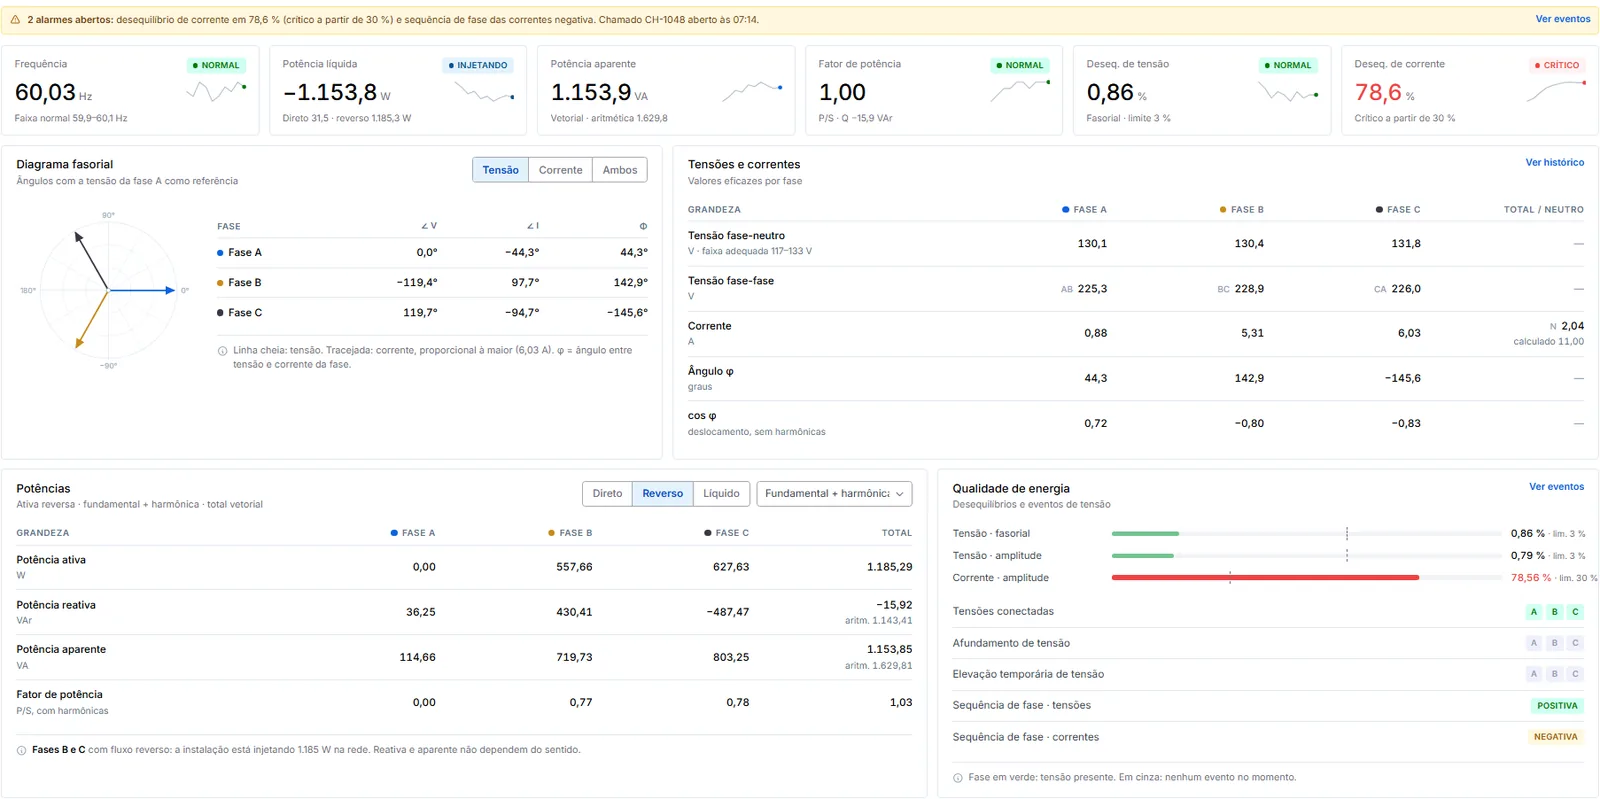
The phasor diagram helps you see what the table says: the voltage arrows sit 120° apart, and the current arrows show the angle of each phase. When the angle between a phase's voltage and current exceeds 90° (in either direction), that phase's active power is negative: energy is flowing out to the grid.
Harmonics: the distortion a regular multimeter doesn't show
Switch-mode power supplies, variable frequency drives, LED lighting and solar inverters don't draw current as a clean sine wave. Distorted current can be broken down into multiples of the grid frequency: on a 60 Hz grid, the 3rd harmonic is at 180 Hz, the 5th at 300 Hz, and so on. THD (total harmonic distortion) sums it all up as a percentage of the fundamental.
Three things every technician should know:
- Multiples of 3 add up in the neutral. The 3rd, 9th and 15th harmonics are "zero sequence": instead of canceling out between phases, they add up in the neutral. That's why buildings full of computers and LEDs have neutrals running hotter than the phases.
- The 5th and 11th "brake" the motor. They're negative sequence: they create a field that rotates backwards, causing heating and vibration.
- High THD at low current is misleading. A phase carrying 0.87 A can show 38% THD, but the absolute distortion is small. That's why the IEEE 519 reference uses TDD, which compares distortion with the facility's demand current rather than the current at that moment.
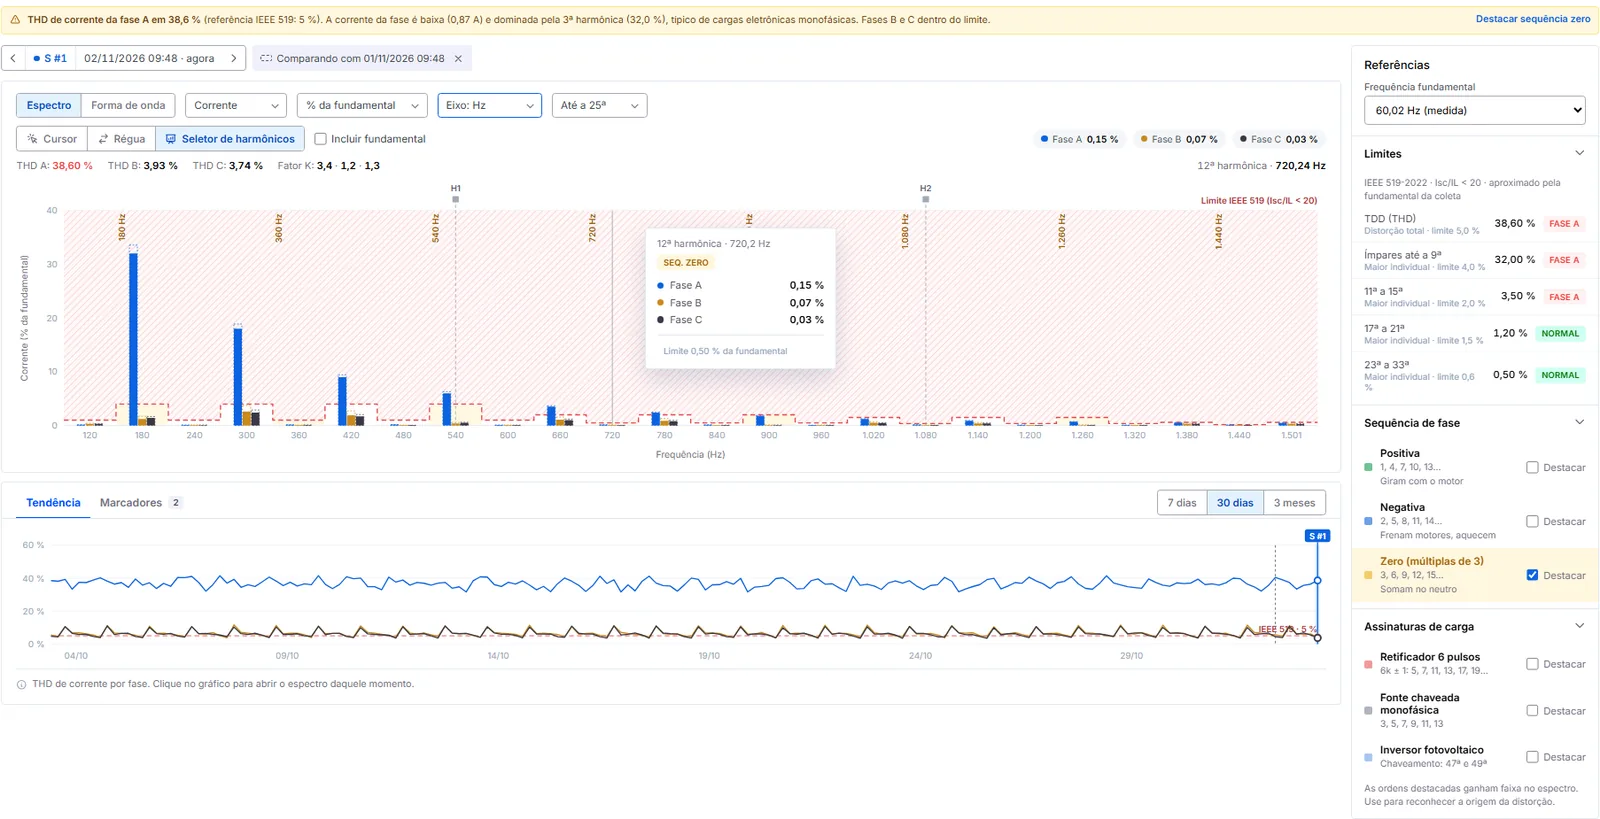
The shape of the spectrum also helps you find the source. A 6-pulse rectifier (common in variable frequency drives) mainly produces the 5th, 7th, 11th and 13th. Single-phase switch-mode supplies produce the 3rd, 5th and 7th. Knowing this lets you look for the right load instead of swapping the breaker.
Power factor: cos φ isn't the whole story
Cos φ only measures the displacement between voltage and current at the fundamental frequency. When harmonics are present, the true power factor (active power divided by apparent power) is lower than cos φ, and a capacitor bank sized on cos φ alone can resonate with the harmonics. Many utilities bill excess reactive energy below a minimum power factor set in the tariff.
One more caution: in facilities that export power, a phase's active power goes negative and the calculated power factor can look odd. Separating forward and reverse flow, as in the power table on the real-time screen, avoids wrong conclusions.
Sites with solar generation: the meter has to be bidirectional
With on-site generation, the question is no longer just "how much do we use" but "how much do we export, on which phase and when". A bidirectional meter shows the daily pattern: consumption at night, export during the day. It also shows what breaks the pattern.
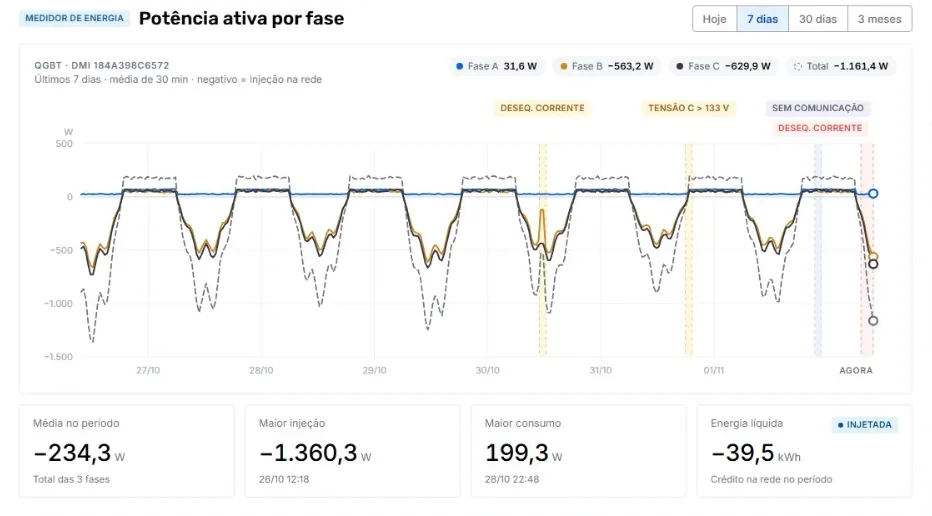
On the chart, events appear right where they happened. The overvoltage on phase C, for example, is above the upper limit of the adequate voltage range for that grid. This tends to happen when generation is high and local consumption is low, and it's the kind of event that trips inverters in the middle of the day.
From alarm to work order
Measuring solves nothing if the alarm just sits on the screen. Monitoring pays off when the event turns into work:
- The limit is exceeded (for example, current unbalance above 30%).
- The system logs the event with time, phase and value, and opens a request linked to the asset.
- The technician gets the work order with context: the chart at that moment, the affected phases and the history of that point.
- At closeout, the cause found (poorly distributed load, loose connection, faulty inverter) is coded into the history, and the next analysis starts with data.
What we're building in taskfield
In developmentThe screens in this article come from the energy monitor we're building in taskfield for our customers. It's already being tested with real meters and will bring together, in the same place as maintenance:
- Real time: voltages, currents, power, power factor and phasor diagram per phase, refreshed every few seconds.
- Harmonics: current and voltage spectrum up to the 25th order, IEEE 519 reference limits, phase sequence and load signatures to track down the source of distortion.
- Bidirectional metering: consumption and export separated by phase, with net energy for the period, for sites with solar generation.
- History and events: trends from 24 hours to 3 months, with unbalance, voltage variations and communication losses marked on the chart.
- One-click request: the event becomes a work order linked to the panel or asset, with the data from that moment attached.
The idea isn't to turn the maintenance team into power quality specialists. It's to make the electrical problem show up with time, phase and probable cause, and reach the technician as a work order they can actually resolve.
Features and screens may still change before launch. If you look after electrical panels, sites with solar generation or power-sensitive equipment, join the waitlist: early customers will help decide what ships first. See also how taskfield serves the energy industry.
Summary
- Many electrical and motor failures start with power quality, not the equipment.
- Voltage unbalance heats motors; current unbalance shows poorly shared load or export on some of the phases.
- Harmonics that are multiples of 3 add up in the neutral; the 5th and 11th heat motors.
- High THD at low current is misleading: compare it with the demand current (TDD).
- With solar generation, the meter has to separate consumption and export per phase.
- The taskfield energy monitor, in development, links every event to a work order.
Calculate it now. Run the numbers with your own data in the free calculators: